Project Story
A Shopify app that shows how much of a sale's revenue the discount actually caused
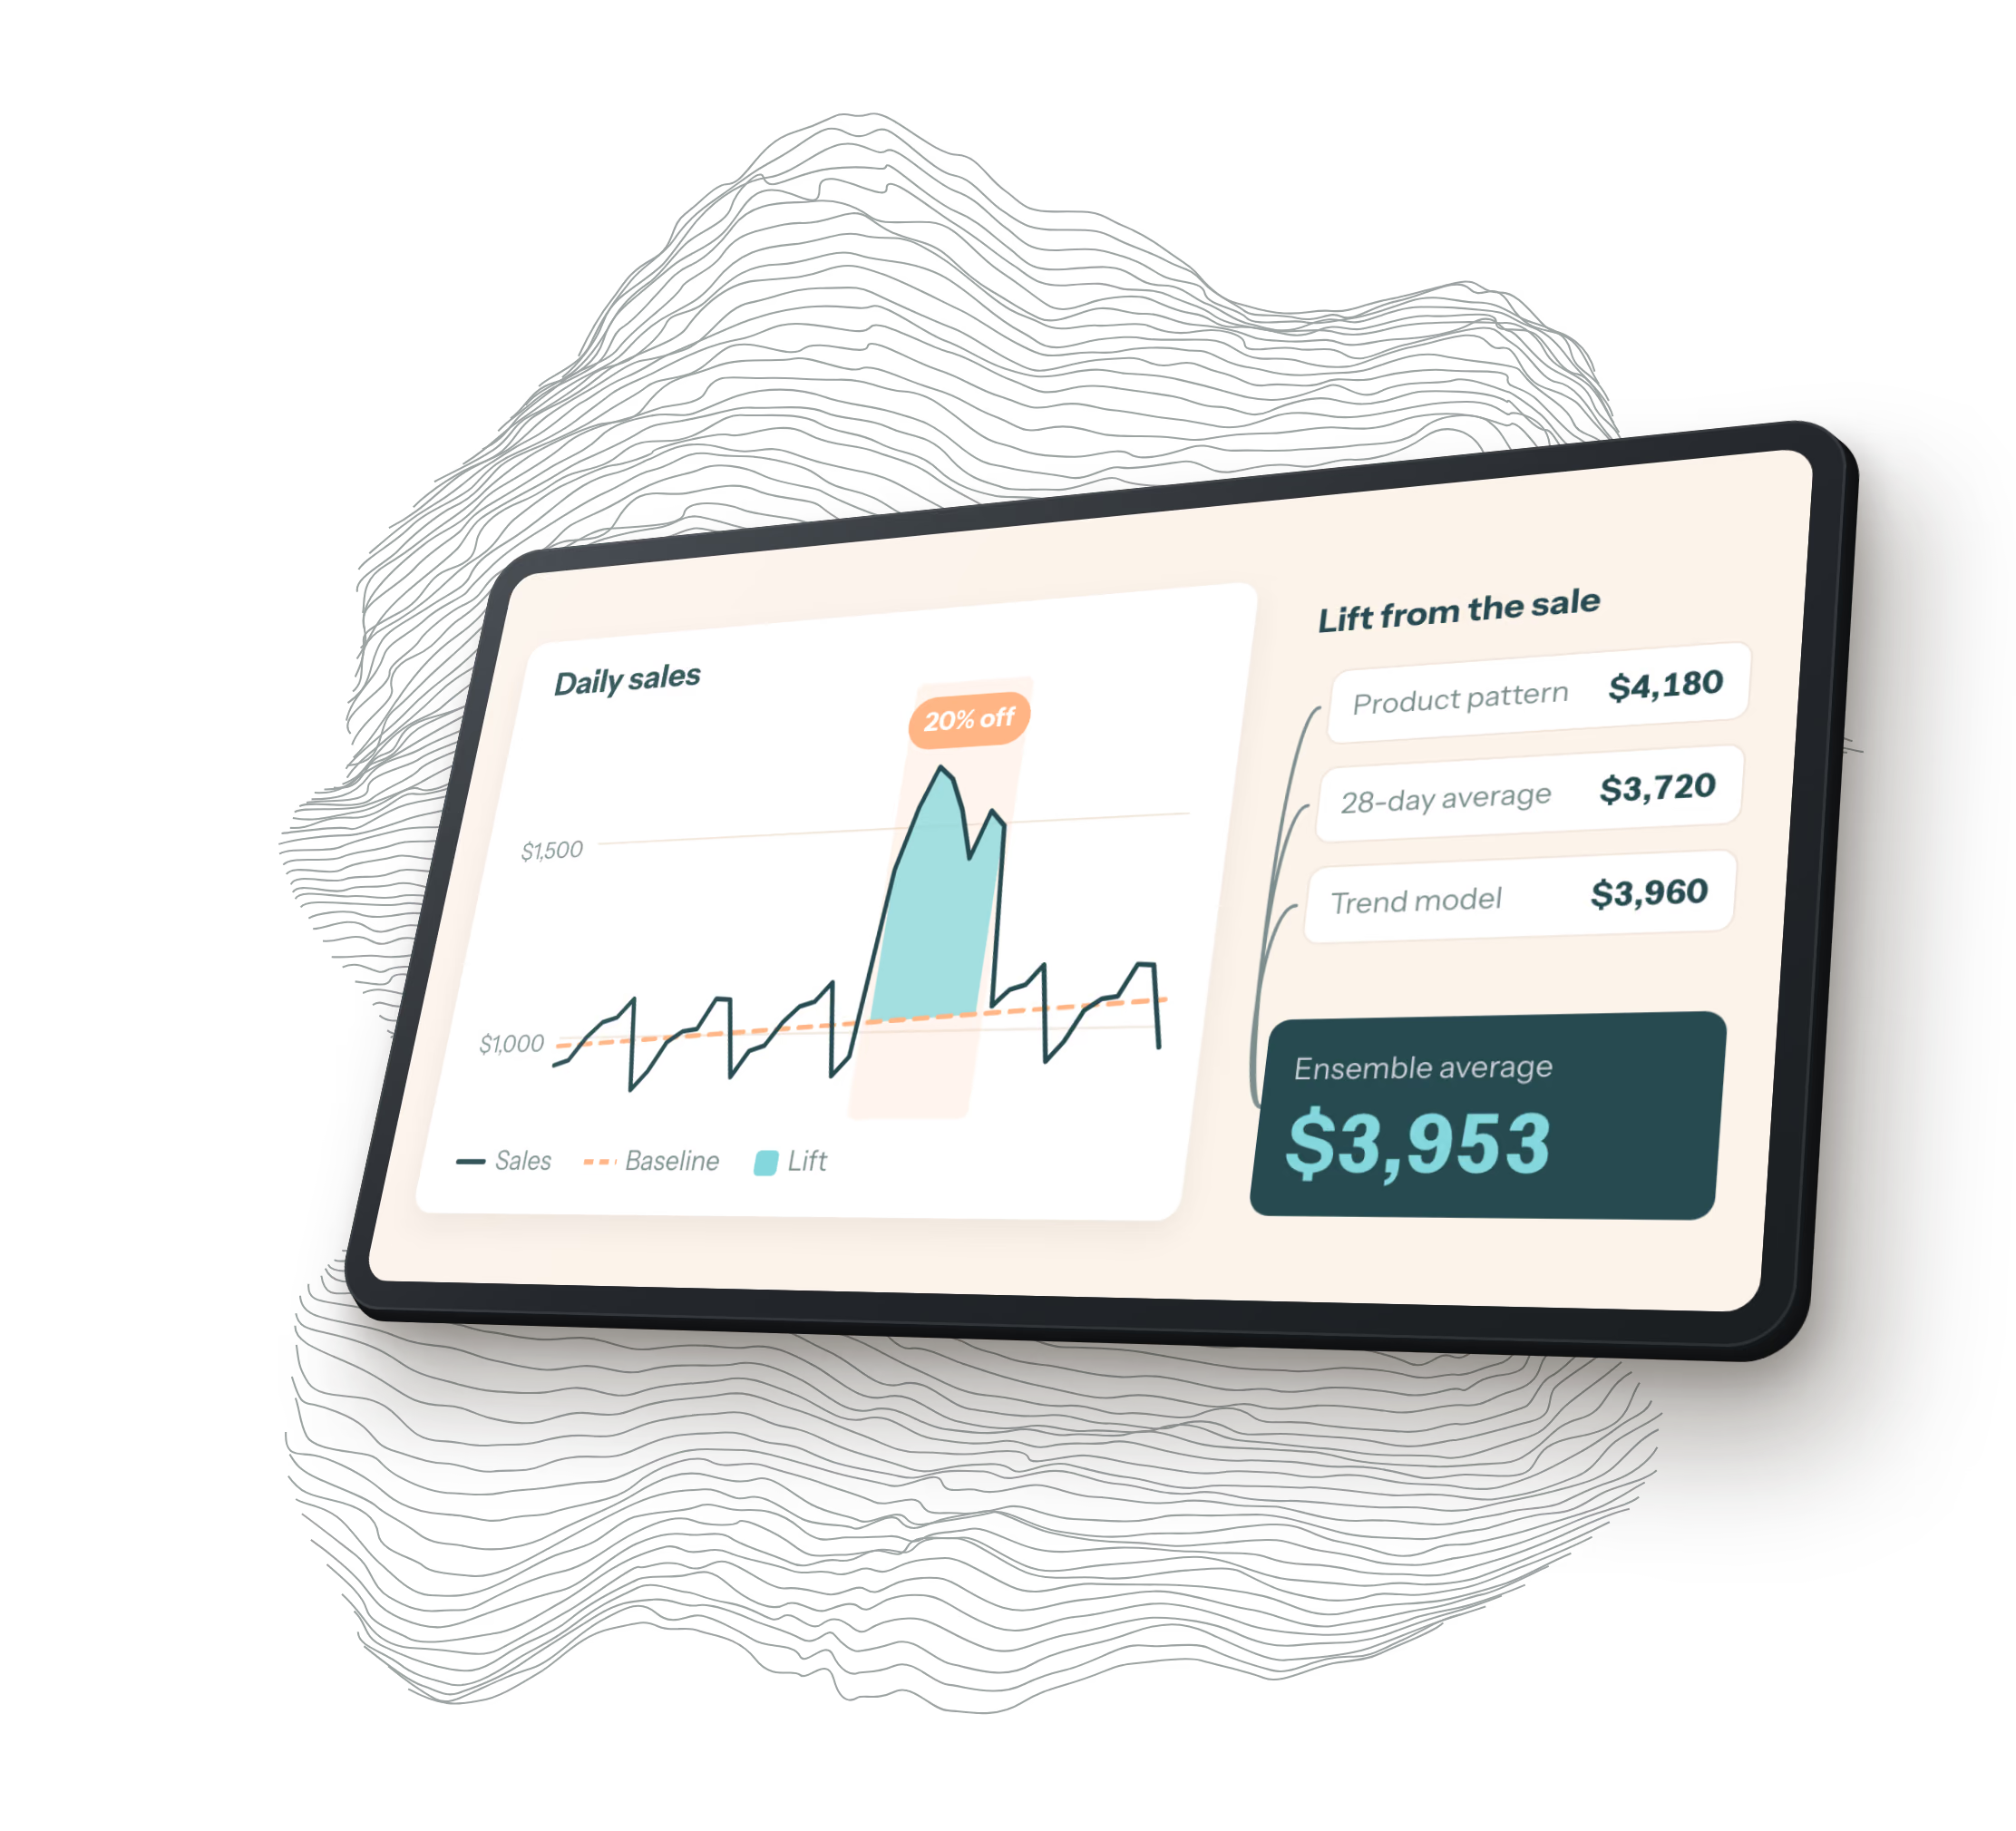
QuantXM asked us to build the Ultimate Discount Calendar, an embedded Shopify app that splits a store's daily sales into what would have sold anyway and what a promotion added on top. It syncs orders through Shopify bulk operations and runs them through a Python ensemble of three baseline models. Shopify approved it for the App Store in June 2025.
- Client
- QuantXM
- Industry
- E-commerce analytics
- When
- 2025
- Status
- Approved on the Shopify App Store in June 2025, unlisted during beta
- Next.js
- TypeScript
- Shopify App Bridge
- Polaris
- Prisma
- PostgreSQL
- Python
- FastAPI
- pandas
- statsmodels
- PostHog
- Resend
Some of a discount's revenue would have come in anyway
Run 20% off for a week and Shopify will tell you what you sold that week. It won’t tell you how much of that you’d have sold at full price. The difference between the two is the number a store owner wants, because it’s the only part the discount paid for.
QuantXM calls the first part base sales and the second incremental sales. The app works out both for every product on every day a store has sold it. Those roll up into monthly and yearly totals.
How the app talks to Shopify
It’s an embedded app, so it runs inside the Shopify admin. The front end is Next.js with Shopify’s App Bridge and Polaris components. Authentication uses Shopify’s token exchange: the page gets a session token from App Bridge, the server verifies it and trades it for an offline access token, and that session is stored in Postgres through Prisma so scheduled jobs can call the Admin API with no merchant in the room. The app asks for read access only, to orders, products and discounts, plus read_all_orders, which Shopify requires for orders older than 60 days.
Besides the privacy webhooks every App Store app has to answer, the app listens for two topics, a bulk operation finishing and the app being uninstalled. Each request is checked against Shopify’s HMAC signature before anything else runs. Shopify can deliver the same webhook more than once, so the app records each X-Shopify-Event-Id and ignores repeats, and a finished bulk operation is also deduplicated by its operation ID, since one export arriving twice would count every order in it twice. The handler answers 200 straight away and does the work after, which keeps Shopify from timing out and retrying. Uninstalling deletes the shop’s data.
Pulling in orders without counting any twice
On install, the app starts a GraphQL bulk operation (bulkOperationRunQuery) for three years of orders with a paid, partially paid, partially refunded or refunded status. Shopify builds the export on its side and sends the finished-operation webhook, and the app downloads the result as JSONL. Big stores produce big files, so anything over 100 MB is streamed and processed in chunks of 50,000 orders, cut only at an order boundary so an order never gets separated from its line items. A run stops taking new chunks at eight minutes, ahead of the ten minute limit on the function.
After that a scheduled job runs another bulk operation for every active shop, covering the 72 hours up to the moment it runs. The windows overlap on purpose so a late or delayed order still gets picked up, and a processed_orders table makes the overlap harmless: an order already counted is skipped.
Each order line becomes a row in product_daily_stats, one per product variant per day, unique on day, product and shop:
- The day is the order’s processed time in the store’s own timezone, read from the shop’s IANA timezone and stored on the shop. A late order on the West Coast lands on the right date. An invalid timezone falls back to America/Denver.
- Gross sales are the original unit price times quantity. Discounts are the sum of every discount allocation on the line, which before September 2025 we were undercounting. Net sales are gross minus discounts.
- Gift cards are left out, and returned units are tracked in their own column.
Getting our totals to agree with Shopify’s own reports took longer than the analysis did. Gift cards and some order statuses are counted differently than you’d guess, and we matched those one at a time. As of our last update to QuantXM in September 2025, orders with refunds or returns were still the remaining gap.
Three ways to estimate normal, averaged into one
QuantXM wrote the model in Python with pandas and statsmodels. We packaged it as a FastAPI service in Docker and built the app around it. The app sends a CSV of daily product stats to POST /api/analyze and gets a job ID back, then polls /api/status/{job_id} every 10 seconds for up to five minutes and downloads the results as CSV. It deletes the job afterward whether or not it succeeded.
The service estimates each product’s normal daily sales, the baseline, three ways:
- Product pattern. From days that aren’t holidays, it learns how many units an order of this product usually holds and its average regular price. A day’s baseline is that day’s orders times those two numbers times a holiday factor: 0.90 on major holidays like Thanksgiving and Christmas, 0.95 on days like Black Friday and Cyber Monday, 0.97 on other retail events. The calendar is the
holidayslibrary’s US list plus Easter and retail dates (Mother’s Day, Super Saturday, Small Business Saturday) written out through 2030. - 28-day average. The product’s rolling mean net sales over the last 28 days. Early in the history it averages whatever days exist.
- Trend model. A multiplicative seasonal decomposition with a 7-day period, which splits sales into a weekly pattern and the trend underneath and takes the trend as normal. If the decomposition fails, it falls back to Holt-Winters exponential smoothing (additive trend and weekly season, with a Box-Cox transform), and if that fails too, to the 28-day average.
Each method is wrong in its own way, so the service averages the three. Lift is net sales minus that average, and lift percentage is lift divided by base.
The model has two limits worth knowing. Each estimate is capped at what actually sold that day, so lift never comes out below zero. A promotion that cut sales shows as zero lift. And a centered weekly trend has no value for the last three days of a series, so on those days the trend model falls back to that day’s sales and contributes no lift. The most recent days lean on the other two methods.
Why the app waits for 60 days of sales
This was a number we got wrong twice. The app started out requiring a minimum count of records before it would ask for an analysis. In November 2025 the nightly update was still failing for some stores, so we ran 24 test files through the service, varying how many rows and how many days each one covered. Every file covering fewer than 14 days failed, however many rows it had, and every file covering 14 or more succeeded, including one with only 100 rows. The model’s own code treats 14 days, two weekly cycles, as the minimum for its 7-day decomposition. We switched the check from records to unique days, set it at 14, and reset the stores’ analyses.
The model’s author at QuantXM then explained the deeper problem. The service calibrates its models on every call, which takes a long series, and a nightly update was sending it a short slice of recent data. His safe fix was to send the whole history every night. We thought that would be too heavy for the server across every store, and asked whether a fixed window would do. He suggested 60 days as a workaround while he reworks the service for updates, and that’s what runs now.
When a nightly run’s own data covers fewer than 60 days, the app pulls the shop’s most recent 60 distinct days from the database, whole days only so a day is never cut in half. A shop that still doesn’t have 60 days is marked pending with an error code like INSUFFICIENT_DATA_23_OF_60_DAYS rather than failed, so a retry job doesn’t keep trying it.
Keeping it running
The app reports to Sentry, PostHog and Datadog, with alerts in Slack. Logs are structured and tagged with the shop and the bulk operation they belong to. A command retries failed bulk operations and another retries failed analyses. Store owners get an email through Resend when their first report is ready and a weekly summary after that.
There’s one weak spot we know about. The Python service keeps job status in memory, so a restart mid-analysis loses the job. The app sees that as a failed analysis, and the retry command picks it up on its next run.
What four e-commerce leaders said
QuantXM showed the beta to leaders at four e-commerce brands. Two of the four said they’d use it as it was. The other two asked for changes, most of them small. All four were confused about what incremental meant and how it was worked out. We added plain definitions and a full description of the calculation inside the app.
What got a reaction was filtering by product and by month, so a store can see which promotion moved which product.
Questions about this project
HQ, a software design and development agency in Ogden, Utah, built the Ultimate Discount Calendar for QuantXM. It's an embedded Shopify app that splits a store's daily sales into base sales, what would have sold anyway, and incremental sales, what a promotion added, per product and per day. Shopify approved it for the App Store in June 2025.
The app sends each store's daily product sales to a Python service that estimates normal sales three ways and averages them. One method multiplies a day's orders by the product's usual units per order and regular price from non-holiday days, with a holiday factor. One uses a 28-day rolling average. One takes the trend from a 7-day seasonal decomposition, falling back to Holt-Winters exponential smoothing. Incremental sales are actual net sales minus that average, never below zero.
It uses Shopify GraphQL bulk operations. On install it exports three years of paid and refunded orders, streaming large exports in chunks of 50,000 orders, and after that a scheduled job exports the last 72 hours for every store. A processed-orders table skips any order already counted, and webhooks are deduplicated by Shopify event ID and bulk operation ID. Each order is assigned to a day in the store's own timezone.
Yes. Shopify approved the Ultimate Discount Calendar for the App Store in June 2025. During its beta it was unlisted, so it doesn't appear in App Store search and is reached through a direct link.
The app waits for 60 days of a store's sales before it estimates base and incremental sales. HQ's tests found the analysis service fails on fewer than 14 days of data, and QuantXM recommended a 60-day window for the nightly updates because the models are calibrated on every run. A store with less history is marked pending until it has enough.
Let's build together
Whether you're looking to design, build, update, or refresh an existing app or website, we can help. Even if we're not a good fit, we will help point you to somebody who might be.
Contact us